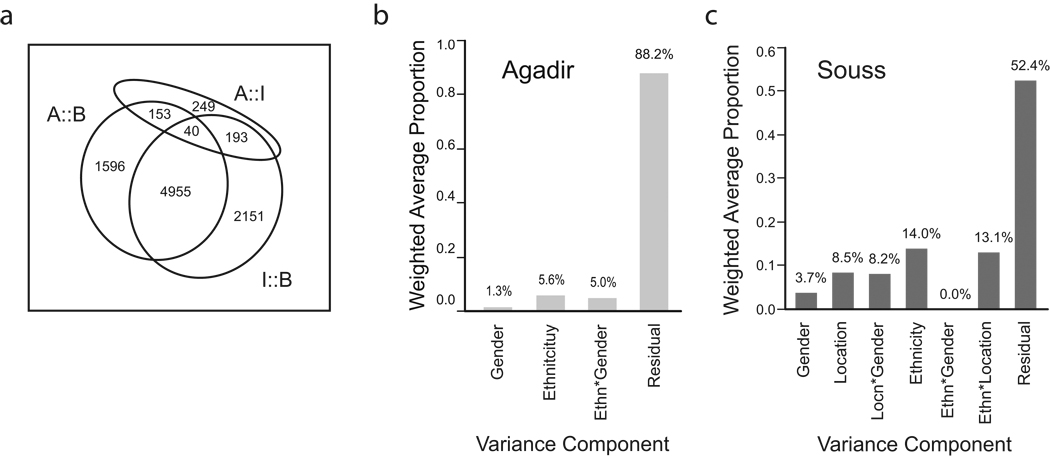
Figure 3. Location impacts gene expression transcriptome-wide.
(a) Venn diagram of the number of genes significant at 1% FDR for ANOVA of the three pair-wise comparisons indicated. Variance components of expression variation (b) just in the 118 residents of Agadir (excluding 9 individuals with strongly positive gPC1 scores, and including reassignment of ethnicity according to gPC2 for just 11 individuals relative to self-report, Supplementary Table 5),where Ethnicity is modeled as the PC2 of the genotype variation as shown in Figure 1a, or (c) for all 22,300 probes in the full sample of 208 individuals.

