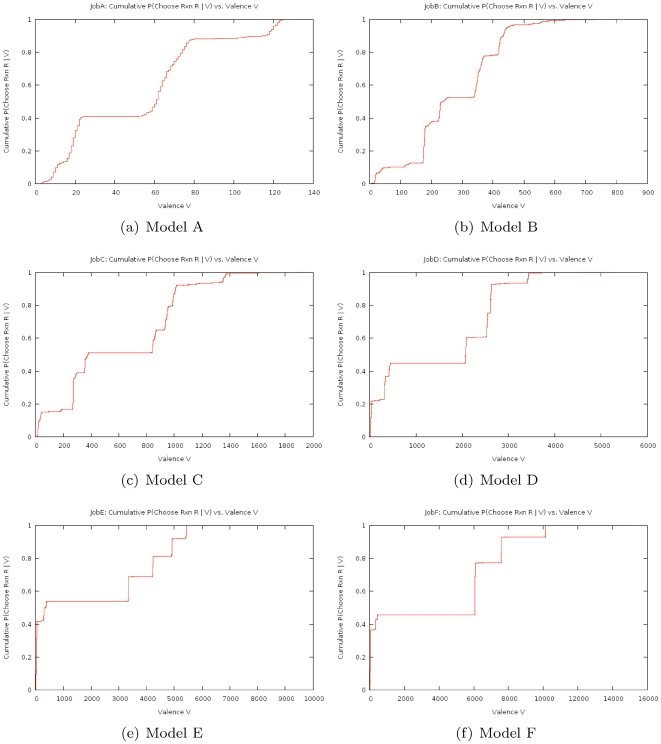
Figure 2. Cumulative distribution function (CDF) plots of reaction valence for all six models.
To compute the CDF we first computed the PDF of reaction valence, weighting each reaction valence by the reaction's average propensity over a pre-computed sample trajectory. We then computed the CDF from the PDF to increase visual salience of the sparsely distributed weights. A steep climb near a particular valence means a significant probability of a randomly chosen reaction having that approximate valence. This, in turn, often indicates the presence of a super-species that is involved in many reactions and benefits greatly from factoring.

