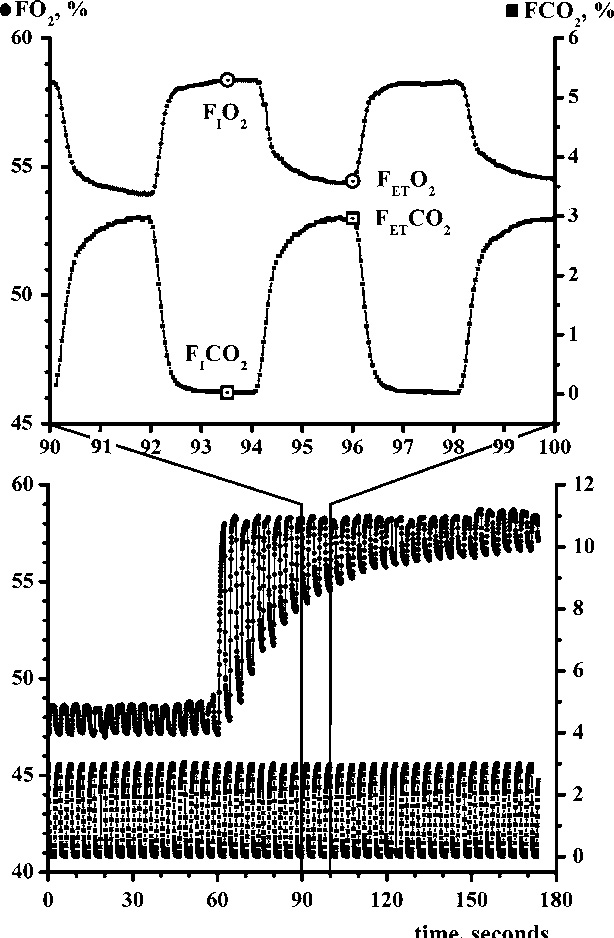
Fig. 1.

Sampling at two frequencies, the waveform sampling rate and two samples per breath sampling rate. Lower frame: the continuous sampling of FO2 (left y-axis) and FCO2 (right y-axis) during a N2 washout procedure. From these tracings (enlarged in upper frame) two samples of FO2 and FCO2 are sampled once during inspiration and as endtidal values for entering into Equations 6 and 7.
