
Fig. 6.
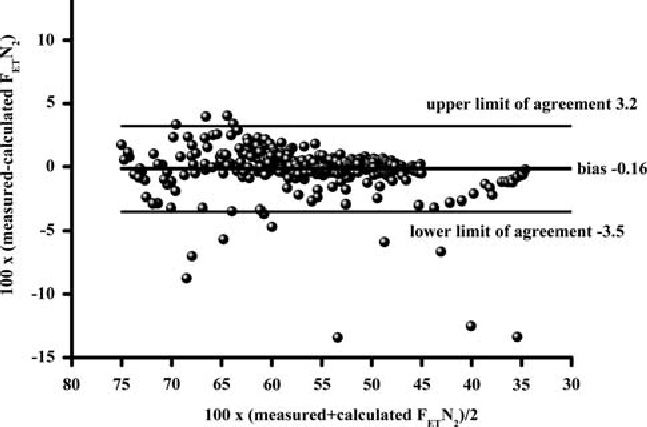
Bland & Altman plot of agreement between pairs of measured and calculated FETN2 according to step response derivation in 16 N2 washout procedures in three healthy volunteers. Bland & Altman analysis showed bias of −0.16, lower and upper limits of agreement at 3.2 and −3.5. The regression equation showed a slope of 0.97, intercept at 1.9 and R2 0.98 with a p < 0.001.