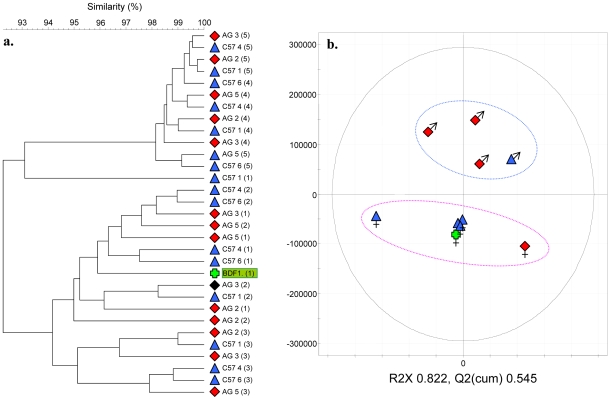
Figure 5. GTM development in genetically distinct, uterine-implanted mice.
(a) UPGMA cluster analysis of fecal DGGE profiles; (b) PCA score plot of the two first PCs of analysis of UPLC-MS urine analysis data set (gender is indicated). The model describes 82% of the variation. Urinary metabolite profiles cluster on the basis of gender (blue cluster boundary, males; pink cluster boundary, females) but not genotype. C57 (blue triangles) and Agoutie; AG (red diamonds) gestated in a BDF1 strain mother (green cross).

