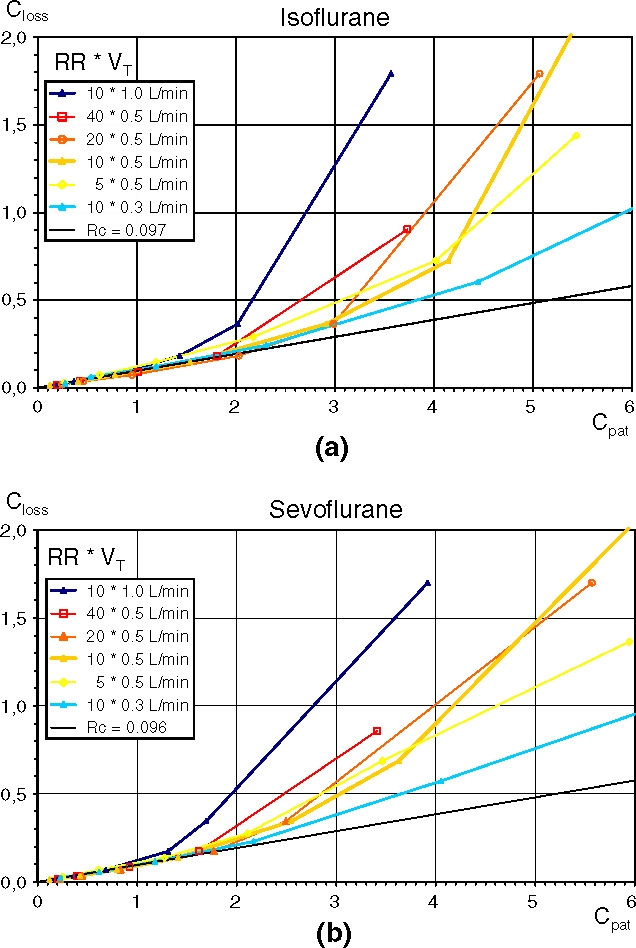
Fig. 2.

(a) and (b) Characteristic curves of AnaConDa® for isoflurane (a) and sevoflurane (b) with different ventilatory settings. The mean anaesthetic concentrations on the ventilator side of the anaesthetic reflector (Closs, [vol%]) plotted against the mean anaesthetic concentrations in the test lung (Cpat, [vol%]). RR respiratory rates, VT tidal volumes. Each curve describes a different ventilatory setting, each point a different infusion pump rate. The straight line delineates a concentration ratio Closs/Cpat of 0.097 (isoflurane) and 0.096 (sevoflurane) respectively.
