
Figure 8. Co-variation of longevity and body mass with telomere length across the available independent comparisons.
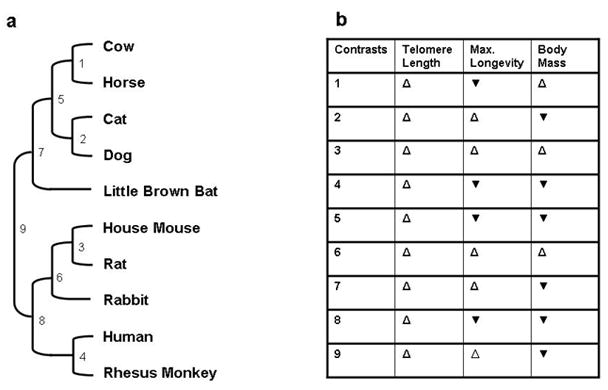
(a) Phylogeny for the relationships between telomere length, maximum longevity and body mass. Branch lengths are not drawn to scale. (b): Direction of variations in telomere length, maximum longevity and body mass among the available independent comparisons. Open, upward-pointed triangles indicate that the two parameters vary in the same direction, while filled, downward-pointing triangles indicate that the parameters vary in opposite directions.