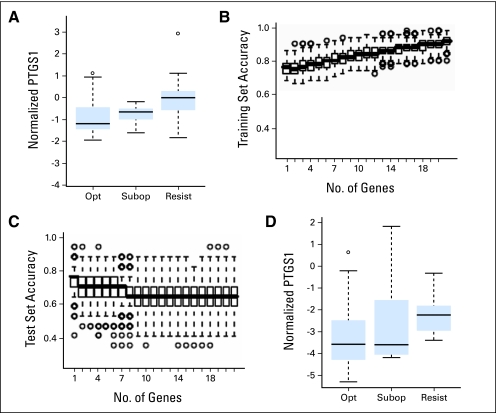
Fig 2.
Higher prostaglandin-endoperoxide synthase 1 (PTGS1) transcript levels are associated with primary imatinib resistance in two different data sets. (A) Comparison of median-normalized PTGS1 transcript levels in total WBCs from the first set of newly diagnosed imatinib-naïve chronic myelogenous leukemia (CML) samples that showed optimal imatinib response (opt), suboptimal imatinib response (subopt) or imatinib failure/resistance (resist), as assessed at 1 year. (B, C) The contribution of each of 21 test genes to prediction accuracy of imatinib response at 1 year among the first set of 68 newly diagnosed patients was determined by linear discriminant analysis (LDA). Plotted are the results of 500 three-fold cross validations with each box demonstrating the distribution of the prediction accuracies including increasing numbers of genes. Accuracies of prediction by LDA in randomly chosen (B) training sets and (C) test sets. Accuracy for the test sets decline with inclusion of more than one gene, with PTGS1 identified as the predictor gene in 481 (96%) of 500 simulations. (D) Comparison of GUSB-normalized PTGS1 transcript levels in total WBCs from a different set of 68 newly diagnosed imatinib-naïve CML samples. PTGS1 transcript levels are again higher in the imatinib resistant/failure group (resist), as assessed at 1 year (P = .008, t-test). (A-D) Box and whisker plots to demonstrate data distributions. For all figures, the boxes show the interquartile range (IQR) with bar in box indicating median values. Values with whiskers indicate a range of 1.5 times of IQR, with circles representing outliers.

