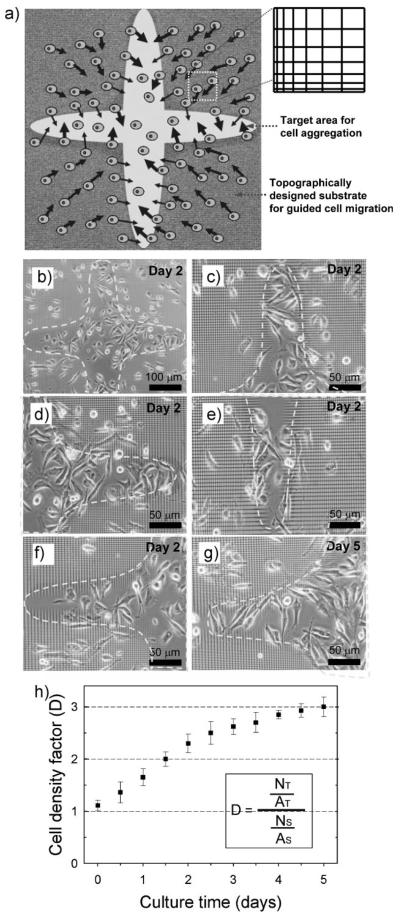
Figure 10.
Topography-induced cell migration to the target area (rounded cross area in the center). a) The strategy for cell aggregation inside the 2D target area by using topographically tailored substrate. b) Cell distribution on a large area at day 2 after seeding. c–f) Spatial distribution of cells at several branch regions of the target space at day 2 after seeding. g) Spatial distribution of cells at the same location of (f) at day 5 after seeding. h) Time-dependent change in the cell density factor (D) in the central target area over a culture for 5 day after seeding. Data from 3 independent experiments were analyzed. Error bar represents mean ± s.e.m.

