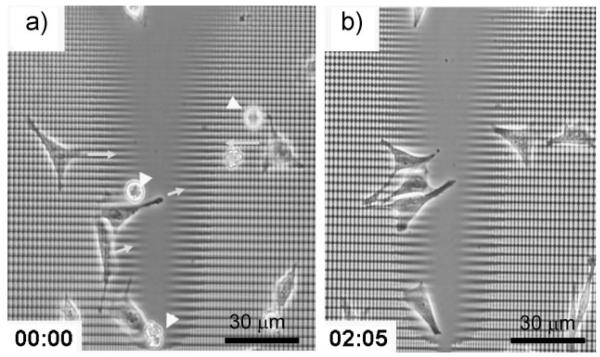
Figure 9.
An example of time-lapse images of cell migration toward the central target area. a) Phase-contrast micrograph of cells adhered onto the topographically gradient lattice pattern moving toward the central target area. b) Another snapshot image at the same location after two hours and five minutes. Yellow arrows indicate the direction of cell migration and white arrow heads indicate cells which are not adhered to the substrate yet at the initial time point of imaging.

