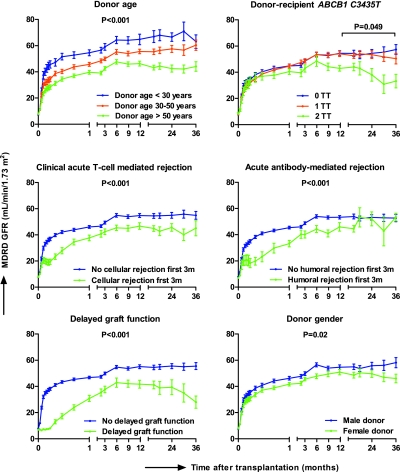
Figure 3.
Determinants of renal allograft function in the first 3 yr after transplantation. Risk factors were selected using mixed-models repeated-measures analysis and backward elimination; P values less than 0.05 were required for inclusion in the final model (Table S21). n = 244, n = 242, n = 208, n = 173, n = 102, and n = 49 at 1, 3, 6, 12, 24, and 36 mo after transplantation, respectively. Results are given as mean ± SEM.

