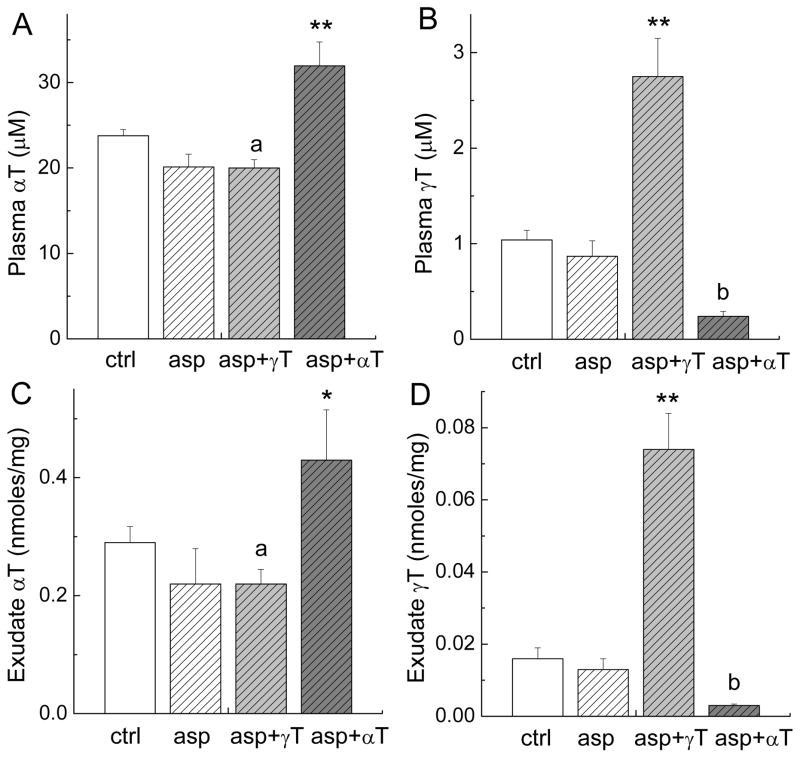
Figure 3. Plasma and exudate concentrations of αT and γT.
The conditions of each treatment are the same as indicated in Fig. 2. *P < 0.05 or **P < 0.01 indicate a significant difference between the combinations and aspirin alone. a(P < 0.05) indicates a significant difference in αT concentrations between ctrl and asp+γT. b(P < 0.01) indicates a significant difference in γT concentrations between asp+αT and asp.

