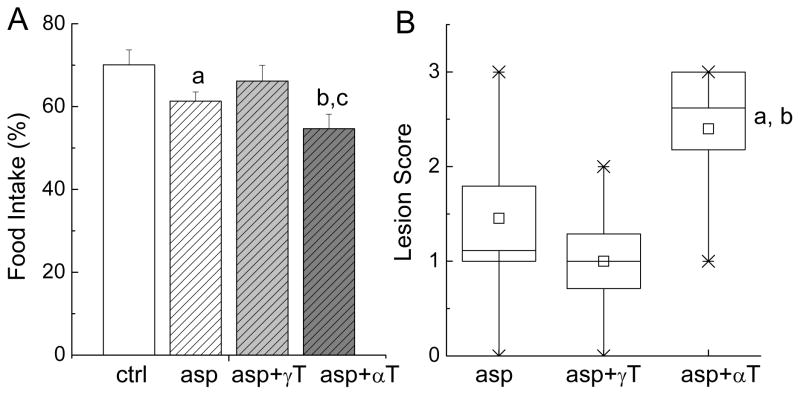
Figure 4. Effect on food intake (A) and stomach injury (B).
The conditions of each treatment are the same as indicated in Figure 2. The food consumption (%) of individual animal (A) was the ratio of the food intake measured after and before the carrageenan injection. Results are expressed as Mean ± SEM. a(P < 0.05) and b(P < 0.01) indicate a statistically significant difference between the asp- or asp+αT-treated rats and the corn oil-administrated animals, respectively. c(P < 0.05) indicates significant difference between asp+γT and asp+αT administered rats. Stomach lesion (B) was expressed in a Box plot showing box as SE and whisker of 5–95%. a(P < 0.05) or b(P < 0.01) indicates a significant difference between the treatment of asp- and asp+αT, or asp+γT and asp+αT, respectively.

