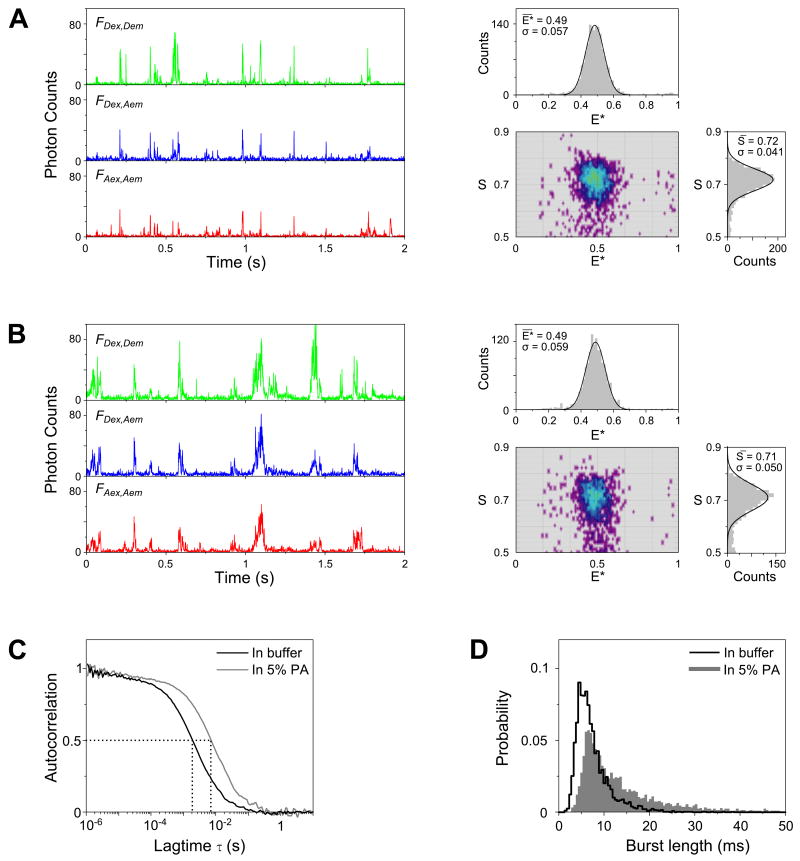
FIGURE 2.
Comparison between in-solution and in-gel measurements.
(A) Fluorescence-intensity time traces (left, binned with 1-ms resolution) and the resulting E*-S histograms (right) of doubly labeled DNA (T1-Cy3B,B18-ATTO647N) freely diffusing in solution. Only molecules containing both the green and red fluorophores are displayed in the 2D E*-S histogram (using the threshold criterion of 0.5 < S < 0.9). Above and on the right of the 2D histogram are the 1D projections of the E* and S axis, respectively. The 1D histograms were fitted with Gaussian distributions (black solid lines); the mean values and standard deviations of the fits are given as insets.
(B) Time traces (left) and the resulting E*-S histograms (right) of the same DNA construct measured in 5% PA gel; the mean E* and S values measured in the gel are essentially identical to the ones in solution. The S histogram in gel is wider due to increased blinking and photobleaching during the longer transit time through the confocal volume.
(C) Extended diffusion of DNA in 5% PA is illustrated by FCS. The autocorrelation curve (FAex,Aem) obtained in-gel (gray line) is shifted towards a slower timescale when compared to the curve measured in solution (black line). Specifically, the average molecular transit time inside the confocal volume (τD) measured in gel (≈7.7 ms) is ≈ 4-fold longer than that measured in solution (≈2.1 ms).
(D) Comparison of the distributions of burst duration (obtained using the burst selection criteria: L=50, M=10, T=2 ms, S>0.5; this maximizes the length of detected bursts) shows a marked increase in the probability of having longer bursts in gel. The probability of observing a burst longer than 10 ms increased ≈3-fold in gel (50% of the selected bursts) compared to in solution (16%).

