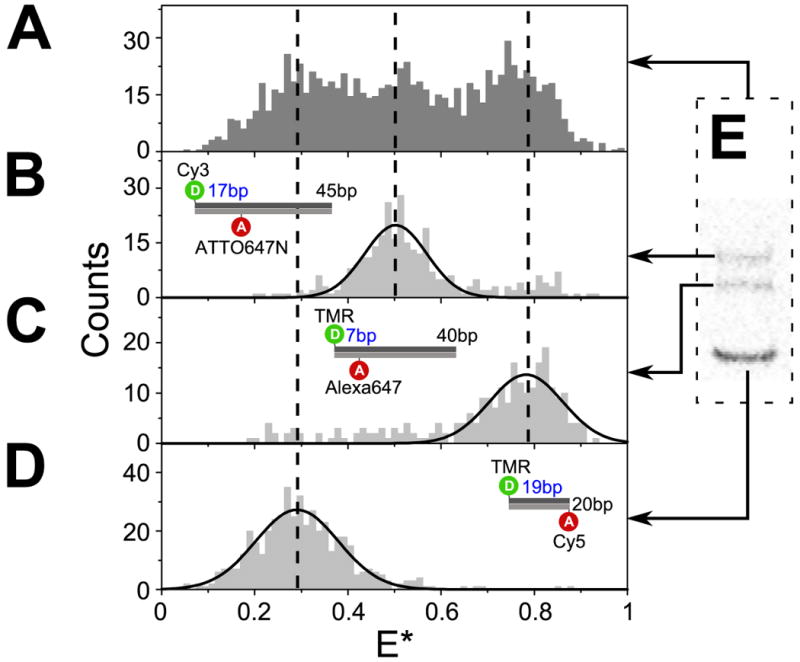
FIGURE 3.

In-gel ALEX separates subpopulations with different electrophoretic mobility.
(A-D) ALEX-based FRET distributions for 3 DNA standards and their mixture. (A) Examination of the mixture of three DNA of different lengths and mean E* using in-solution ALEX could not clearly resolve the individual species. In contrast, in-gel ALEX examination of the same mixture after electrophoretic separation in 10% PA recovered E* distributions for the individual species: (B) T1-Cy3,B18-ATTO647N (intermediate FRET, 45 bp;), (C) T1-TMR,B8-Alexa647 (high FRET, 40 bp), and (D) T1-TMR,B20-Cy5 (low FRET, 20 bp). The dashed vertical lines indicate the mean E* values of the individual subpopulations as measured in gel. The mean E* values measured in gel were consistent with the mean E* values measured separately for each type of DNA in solution.
(E) Fluorescence image (FAex,Aem) of an analytical gel (10% PA) showing the separation of the DNA mixture described in (A).
