FIGURE 5.
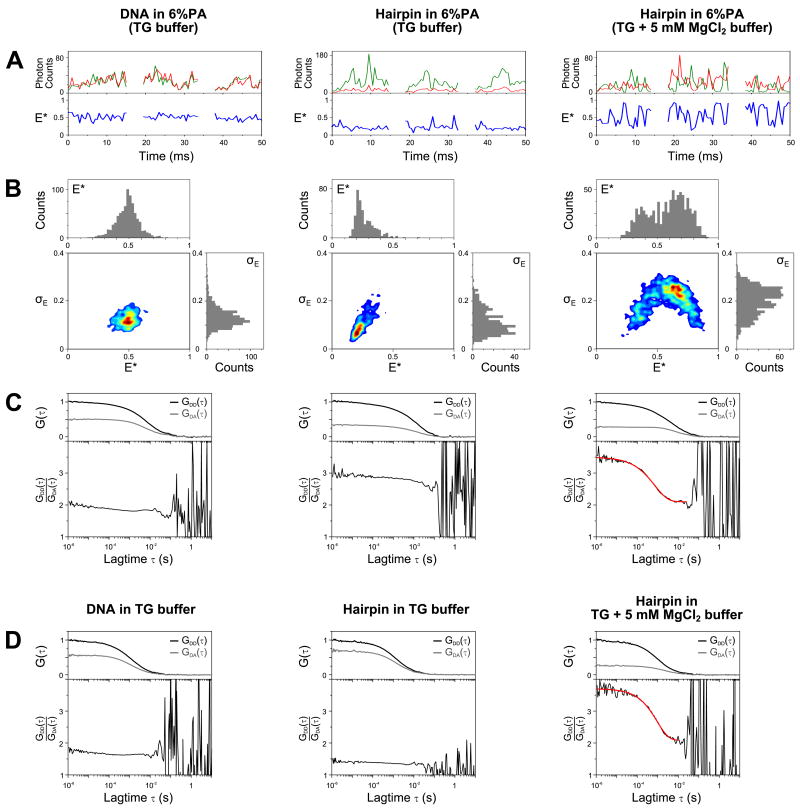
Studying DNA hairpin conformations using in-gel ALEX.
Double-stranded DNA (T1-Cy3B,B18-ATTO647N; leftmost column) and DNA hairpin (middle and rightmost columns) were measured in 6% PA (A-C) and in solution (D). The samples in the left and middle columns were measured in TG buffer, while the hairpin in the rightmost column was measured in buffer and gel containing 5 mM MgCl2.
(A) Representative time traces of the above samples in 6% PA (burst selection criteria: L=60, M=10, T=1 ms, S>0.5, burst length>8 ms; per-0.5ms bin filter: S>0.5, FDex>10; see Data analysis). The upper panels show the photon counts due to ALEX partitioned into 0.5-ms time bins (green: FDex,Dem; red: FDex,Aem; FAex,Aem not shown). Notice that strong anti-correlation between FDex,Dem and FDex,Aem is visible, especially in the hairpin sample with 5 mM MgCl2.
(B) Two-dimensional plots of E* and standard deviation of E* (σE) for bursts detected using the selection criteria given in (A). Top subpanel in each 2D plot: E* histogram; right subpanel: σE histogram. For relatively static samples (DNA and hairpin in TG buffer), the σE distributions are biased towards low σE value (<0.2). For the dynamic sample (hairpin in 5 mM MgCl2), the σE distribution is shifted towards higher value (σE>0.2) indicating the higher variability of FRET values within a burst. Note that the FRET distribution for this sample is shifted towards intermediate FRET value as compared to that measured in solution (Fig. 4B); this is caused by an increased FRET averaging within the fluorescence bursts, as individual hairpin molecules sample both the folded and unfolded conformations many times during their transit from the confocal spot.
(C) Determination of interconversion rates using the FCS-ratio method35. Top subpanels: donor autocorrelation [GDD(τ), black lines] and donor-acceptor cross correlation [GDA(τ), grey lines] curves normalized such that GDD(τ) curves fall between 0 and 1. The amplitude of the cross correlation curve is proportional to the relative concentration of the doubly labeled species, therefore samples with differing donor-acceptor concentrations will have different maximum correlation amplitudes. Bottom subpanels: ratios of GDD(τ) and GDA(τ) (black lines) and the fitted function (red line). The parts of the curves above 20 ms are dominated by noise due to the low amplitudes of the correlation curves, and consequently were not considered during fitting. The DNA and hairpin sample in the absence of MgCl2 showed little dynamics; however, the DNA-hairpin sample in 5 mM MgCl2 exhibited a large fluctuation that can be fitted with a stretched exponential function with mean relaxation time (<τ>) of 0.92 ± 0.23 ms (with the standard deviation calculated from 6 replicates).
(D) Determination of interconversion rates for samples in solution using the FCS-ratio method. Similar to (C), the DNA and hairpin samples showed no dynamics in the absence of MgCl2; in contrast the hairpin sample in 5 mM MgCl2 exhibited large fluctuations with a mean relaxation time (<τ>) of 1.08 ± 0.25 ms (standard deviation from 6 replicates). The similarity of interconversion rates in solution and in gel shows that the gel matrix largely preserves the dynamics of the DNA-hairpin.

