Figure 1.

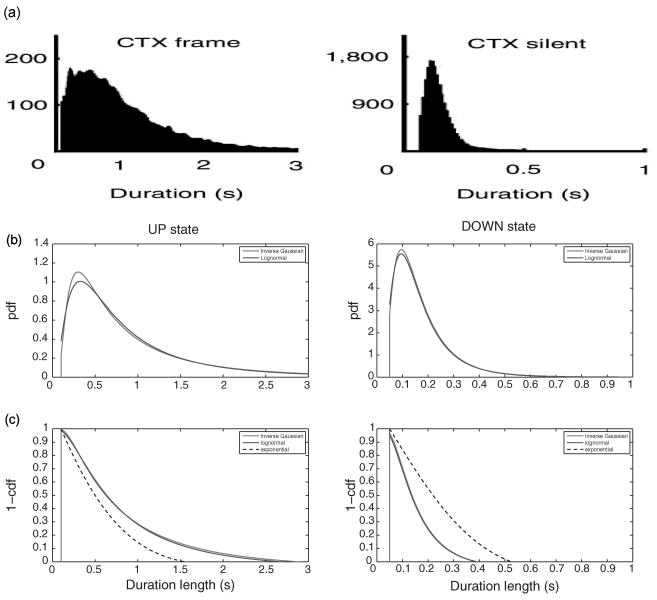
(a) The duration histograms of the UP (mean 0.96, median 0.67, support [0.1, 3], unit: second) and DOWN (mean 0.17, median 0.13, support [0.05, 1], unit: second) states of spiking data recorded from four behaving rats' visual cortex during SWS. Note that the statistics used in b are identical to those in (Ji & Wilson, 2007, Figure 2b). The y-axis in both plots shows the count statistics of all cortical UP and DOWN durations. (b) Censored versions of the log-normal and inverse gaussian pdfs for the UP (left panel) and DOWN (right panel) states. (c) Censored versions of the log-normal and inverse gaussian survival functions (1-cdf) for the UP (left panel) and DOWN (right panel) states. As comparison, the dashed lines in b and c show the holding time probability for an exponential distribution. Note that in the UP state, the holding time probability in both two-parameter distributions decays more slowly than that of the exponential distribution, whereas in the DOWN state, the holding time probability of exponential distribution decays more slowly than the others.
