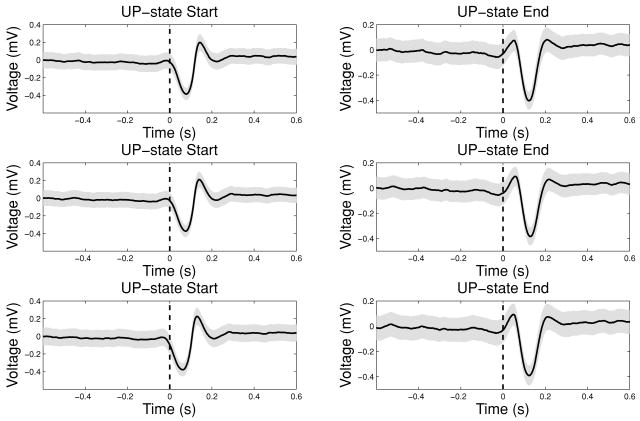
Figure 14.
Cortical EEG averages (mean ± standard error of the mean, shown by trace width) triggered by the classified UP state start and end time stamps (for visualization purposes, the standard error of the mean in all plots is amplified by 10 times its original value). From top to bottom: Results from the threshold-based method, the HMM method, and the MCEM method. The start of the UP state is aligned with the K-complex signal that has a biphasic wave switching from a negative dip to a positive peak, which lasts about 200 ms.

