
Figure 2.
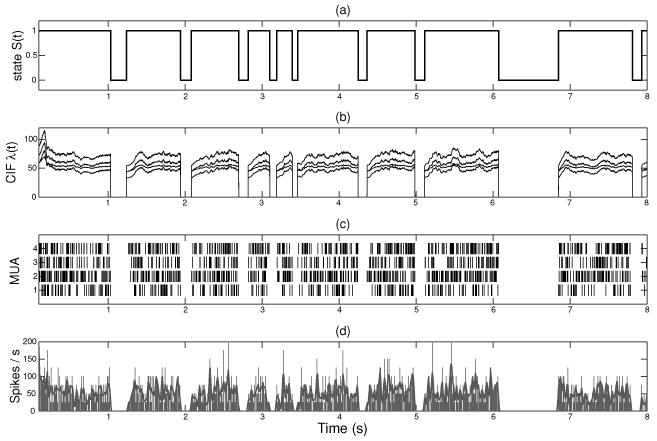
Synthetic data. (a) The simulated UP and DOWN hidden state process. (b) The simulated time-varying traces of conditional intensity function (CIF) λc(t) (c = 1, …, 4). (c) The four simulated spike trains. (d) The averaged firing rate across four spike trains (the solid gray curve corresponds to the temporally smoothed firing rate using a 30 ms width gaussian kernel).