
Figure 5.
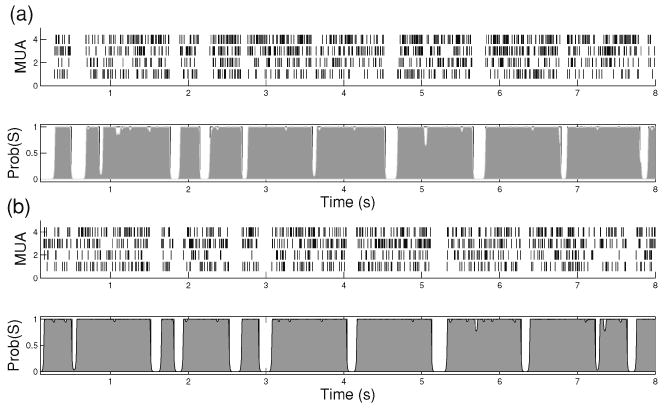
Snapshot illustrations of simulated synthetic spike trains and the estimated state posterior probability from the (a) HMM and (b) continuous-time semi-Markov model (b). The shaded area denotes the posterior probability of the hidden state being in an UP state. The estimation error rates (compared with the ground truth) in these two cases are 1.9% and 1.4%, respectively.