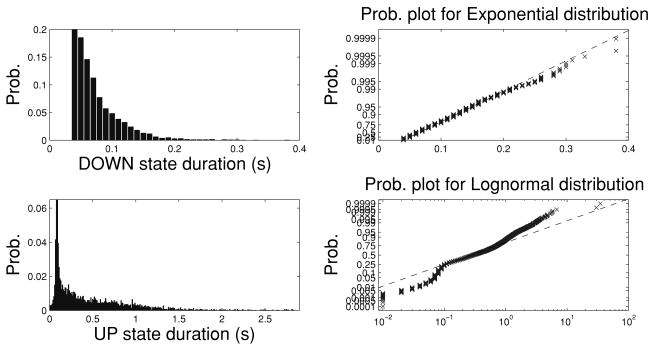
Figure 9.
Fitting the real-world sojourn-time duration length for the DOWN and UP states, where the UP or DOWN state classification is obtained from the discrete-time HMM estimation result. (Left panels) Histograms. (Right panels) Fitting the sojourn durations with exponential (for the DOWN state) and log-normal (for the UP state) distributions. If the sample data fit the tested probability density, the data points will approximately match the straight line in the plot.

