Figure 3.
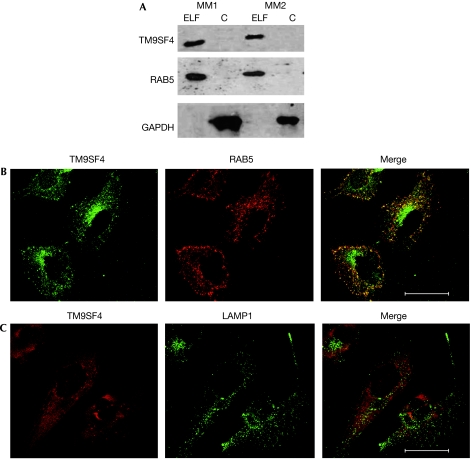
Subcellular localization of TM9SF4. (A) Western blot analysis of TM9SF4, GAPDH and RAB5 for detection in sucrose gradient-separated subcellular fractions. ELF and C fractions of MM1 cells (lanes 1 and 2) and MM2 cells (lanes 3 and 4). (B) CLSM analysis of TM9SF4 (green) and RAB5 (red). (C) CLSM analysis of TM9SF4 (red) and LAMP1 (green). Yellow/orange areas in merged picture indicate co-localization. Scale bars, 47.62 μm. C, cytosolic; ELF, endo-lysosomal fraction; GAPDH, glyceraldehyde 3-phosphate dehydrogenase; CLSM, confocal laser scanning microscopy; MM, metastatic melanoma; TM9SF4, transmembrane 9 superfamily protein member 4.

