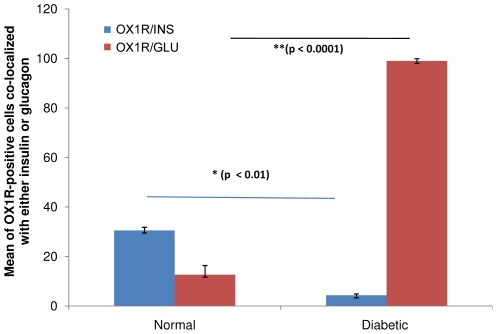
Figure 3. Mean number of pancreatic OX1R-immunoreactive cells containing either insulin or glucagon.
Histograms of the mean of the distribution of OX1R-immunoreactive cells containing either INS or GLU in normal and diabetic (4 weeks after the onset of diabetes) rat pancreas. *(p<0.01: OX1R/INS in control versus diabetic); **(p<0.0001: OX1R/GLU in control versus diabetic). INS = insulin, GLU = glucagon. (10 islets from 6 animals/group).

