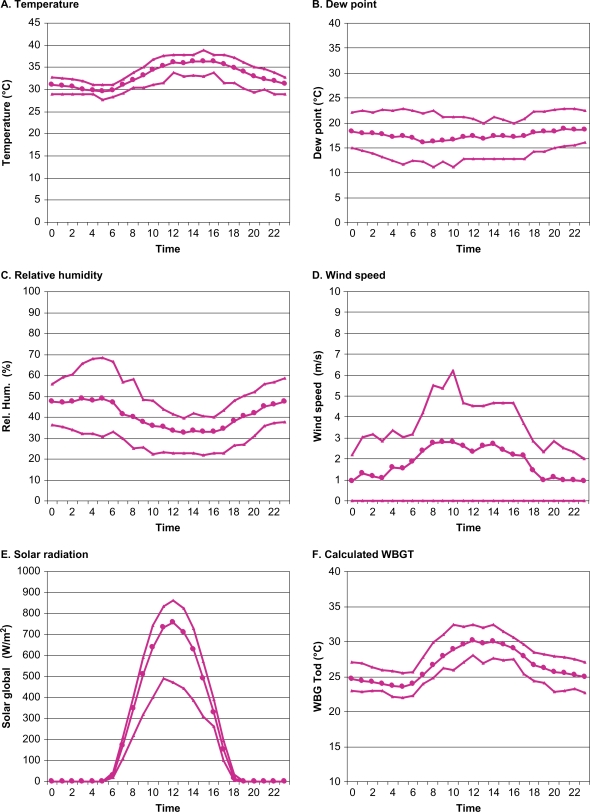
Fig. 2.
Examples of hourly data in a Population Heat Exposure Profile for Delhi, August 1999. Includes shade temperature, dew point, relative humidity, wind speed, solar radiation (global) and WBGT outdoors (middle curve, averages; bottom and top curves, 5th and 95th percentiles of values for each hour on individual days during the month).

