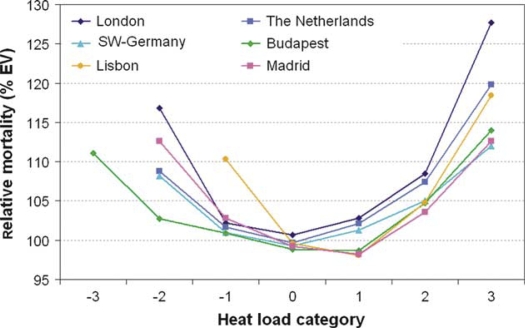
Fig. 1.
Thermal stress-related mortality as deviation from the expected value for selected European cities and areas 1986–1996 during different thermal stress categories (after 36 and 37). −3, strong cold stress; −2, moderate cold stress; −1, slight cold stress; 0, thermal comfort (no thermal stress); 1, slight heat load; 2, moderate heat load; 3, strong heat load, taking acclimatisation into account.

