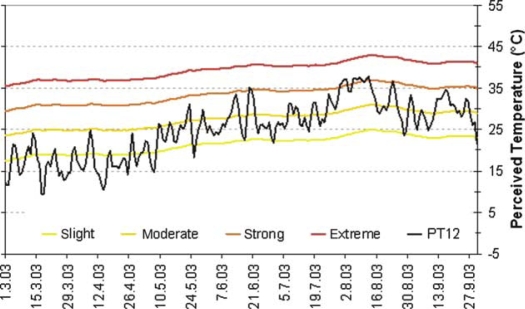
Fig. 2.
Example of daily values of Perceived Temperature at 12 UTC (black line) for the weather station Lisbon (Portugal) from March to September 2003 (36). Compared to Table 1 the coloured lines indicate the variable thresholds for the different thermal stress categories specifying acclimatisation.

