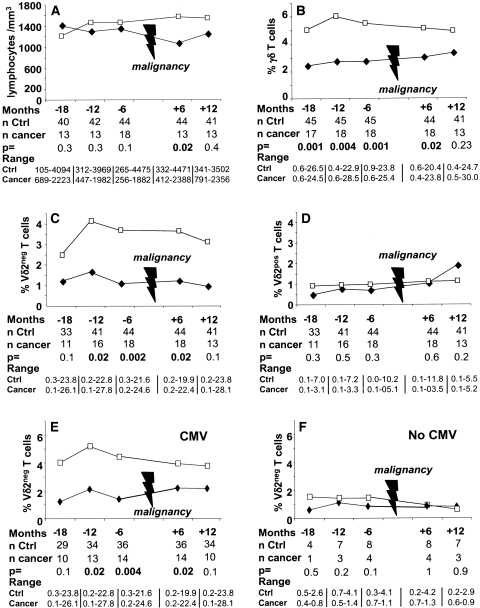
Figure 1.
Evolution of γδ T cells. Evolution of the median (A) number of lymphocytes, (B) percentage of γδ T cells, (C) Vδ2neg γδ T cells, and (D) Vδ2pos γδ T cells among total T cells before and after cancer occurrence in KTRs with cancer (♦) and their matched controls (□). (E, F) Evolution of the medians of Vδ2neg γδ T cell percentage before and after cancer occurrence in KTRs with cancer (♦) and their matched controls (□) according to history of CMV. (E) Patients who have been in contact with CMV (before or after transplantation). (F) Patients naïve for CMV infection.

