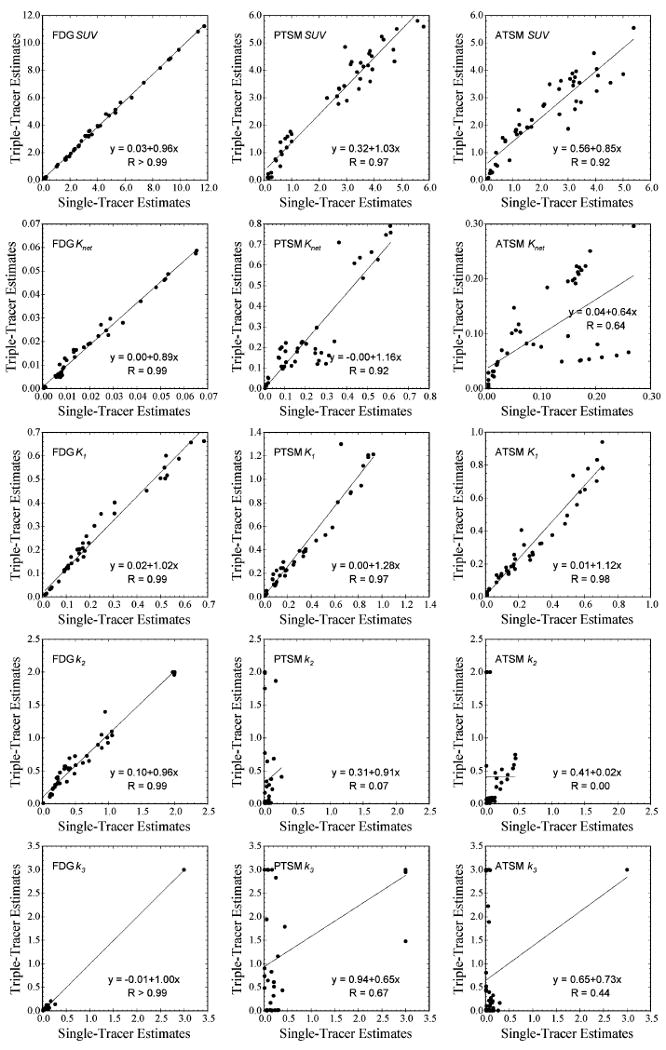
Fig. 8.

Scatter plots of all triple-tracer imaging measures recovered from triple-tracer versus separate single-tracer imaging with FDG injected at 0 min., PTSM at 10 min., and ATSM at 20 min. The imaging parameter is labeled on the upper-left hand corner of each plot, and the vertical and horizontal axes represent the parameter estimates recovered from triple-tracer imaging and single-tracer imaging, respectively. All FDG measures were well recovered, indicating that imaging two additional 62Cu tracers simultaneously with FDG does not substantially corrupt the FDG information.
