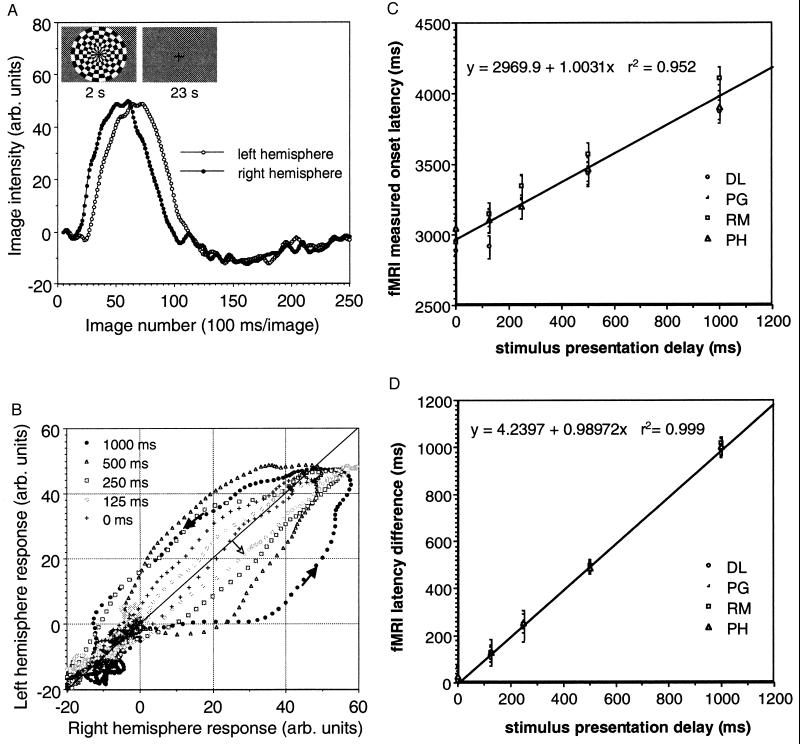
Figure 1.
Hemifield experiment. (A) Typical fMRI response from left and right hemispheres of V1 because of a 500-ms offset between left and right side checkerboard presentation of a single subject (Inset and see Materials and Methods). (B) Lissajous plot of left-hemisphere fMRI signal vs. right-hemisphere fMRI signal in V1 for a single subject and all presentation delays. Time evolution is indicated by the dark arrowheads. Phase delays during onset appear on or below the diagonal (right hemisphere leads left since left hemifield appears first), while phase delays on the falling side of the response appear above the diagonal. (C) Plot of fMRI onset delay for left hemisphere (see Materials and Methods) vs. actual presentation delay. (D) Plot of fMRI latency between hemispheres referenced to the onset of the right-hemisphere activity (see Materials and Methods) vs. actual presentation delay.

