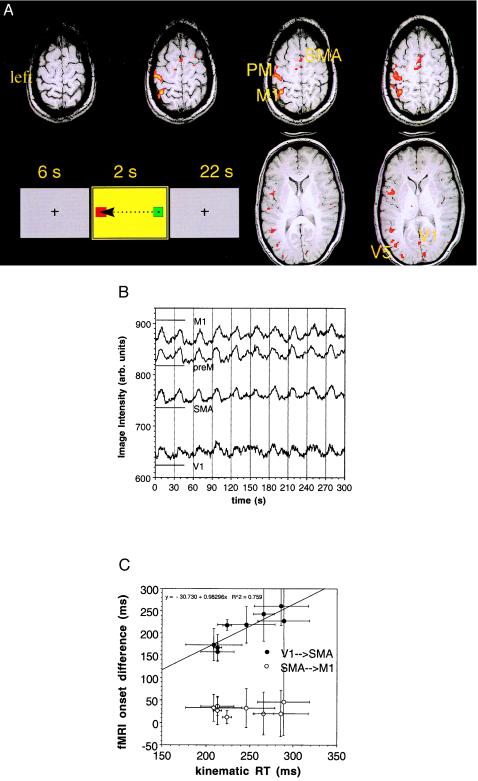
Figure 2.
Visuomotor reaction-time experiment. (A) Activation maps generated by using the cross-correlation approach of the areas invoked by the visuomotor task in a single subject. The activation maps, derived from EPI images with 1-cm slice thicknesses, have been interpolated onto the much thinner anatomic slices. preM, premotor area; M1, primary motor area; SMA, supplementary motor area; V5, motion-sensitive area of visual cortex; V1, primary visual cortex. These areas have been determined anatomically. (B) fMRI responses for 10 trials after bandpass filtering and Fourier interpolation in the four areas chosen for analysis (see Materials and Methods). The visual stimulus that cued subject motor response is shown as an Inset along with the direction of cursor movement. (C) Plot of fMRI onset delay between V1 and SMA (see Materials and Methods) vs. measured reaction time from kinematic trace as well as the onset differences between SMA and M1 vs. RT. Note there are eight points, as two of the six subjects were repeated to assess consistency. In order of increasing kinematic RT, the subjects are LS(2), BG, JD, ML, DB(2), LS(1), DB(1), and ET. The number in parentheses denotes the session number for those scanned twice. Note that RT improved on the second session in both these subjects, demonstrating some practice effect.

