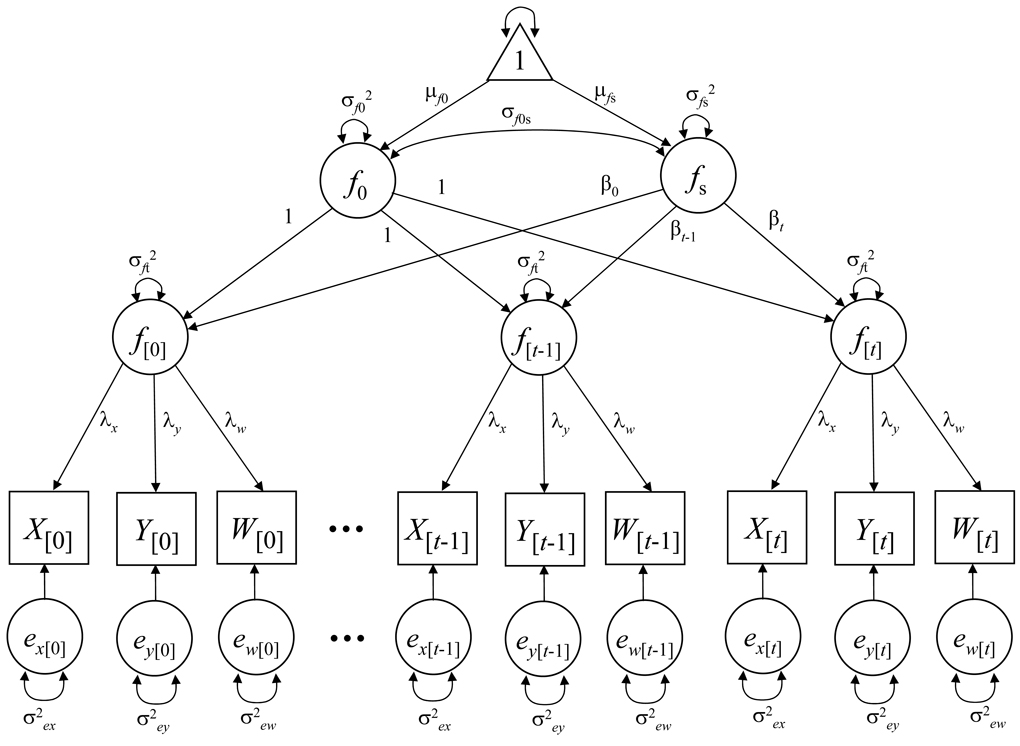
Figure 1.
Path diagram of a second-order latent growth model. Manifest variables are represented by squares. Latent variables are represented by circles. The triangle represents a constant to estimate the means and intercepts. Although not depicted in this figure, the intercepts of the manifest variables are estimated. Also not depicted in this figure are the covariances among same manifest variables at adjacent time points. Factor loadings and unique variances are represented as invariant over time.

