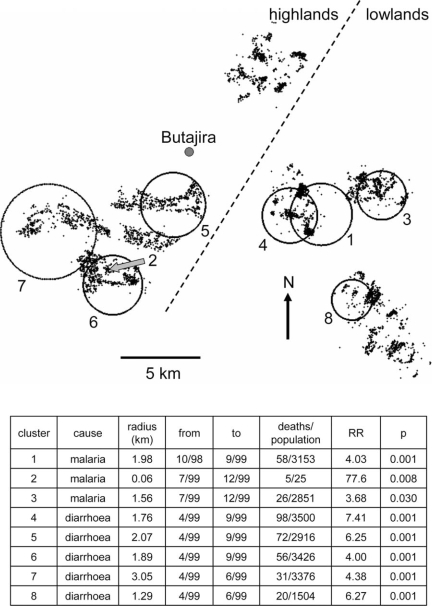
Fig. 4.
Space-time clustering analysis of malaria deaths (n=364) and diarrhoea/malnutrition deaths (n=614) among 7,411 households (small dots) during 1998 and 1999 in the Butajira district. All the eight clusters shown represent areas/periods of significantly high mortality, as detailed at the base of the figure.

