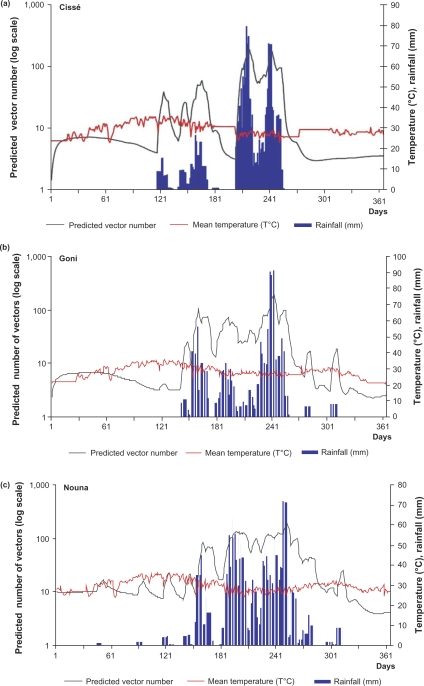
Fig. 2.
Mean temperature and rainfall-based predictions of A. gambiae population abundance for each site: (a) Cissé, (b) Goni and (c) Nouna. Simulated A. gambiae population abundance (black curve) is plotted against the daily temperature (red curve) and the preceding two weeks’ cumulative rainfall (blue curve).

