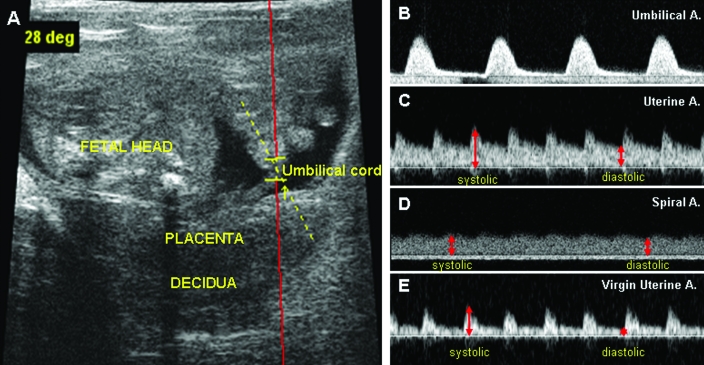
Figure 2.
Examples of ultrasound microscope B-mode images from a gd16 BALB/cAnNCrl mouse. (A) Fetal, placental, and maternal decidual areas. The angle of the Doppler beam was less than 30°. Doppler velocity waveforms from the (B) umbilical artery, (C) uterine artery, and (D) transformed spiral artery are shown. (E) Compared with the flow pattern associated with pregnancy (panel C), the uterine artery of virgin BALB/c mice yielded a higher-resistance Doppler waveform. Comparing the time interval between systolic (or diastolic) peaks of the uterine artery and umbilical artery reveals that in mice, the fetal heart beat is much slower than the maternal heart beat. The reverse is seen in human pregnancy.49 The difference between systolic and diastolic peaks (red lines in panels C and D) was greater in the source uterine artery than in its modified spiral artery tributary. These differences can be evaluated by multiple indices including pulsatility index, resistance index, ratio of systolic to diastolic flow, and so on. Pulse repetition frequency, 10 kHz; wall filter, 100 Hz; display window, 2000 ms; sound speed, 1540 m/s; Doppler gain, 5.00 DB. The red line in image A is a wire frame overlay for pulsed-wave Doppler ultrasonography.

