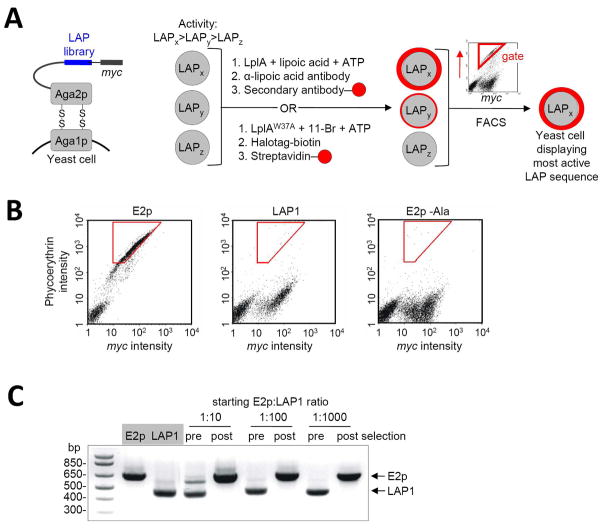
Figure 2.
Yeast display selection scheme and results of model selections. (A) Left: The LAP library (blue) is displayed on the yeast surface as a fusion to Aga2p protein. A C-terminal myc epitope is used to quantify LAP expression level. Right: Selection scheme. Yeast cells displaying three sample LAP sequences, with high (LAPx), moderate (LAPy), and low (LAPz) activity are shown. The yeast cells are collectively labeled with lipoic acid or 11-Br probe. The former is detected with anti-lipoic acid; the latter is detected with HaloTag-biotin,30 followed by streptavidin-fluorophore conjugate. The yeast pool is then sorted (sorting gate in red) on the basis of both ligation extent (red probe intensity) and LAP expression level (c-Myc staining intensity), to enrich the most kinetically efficient LAP peptides. (B) Determination of labeling and sorting conditions for model selections. FACS scatter plots are shown for yeast displaying E2p, LAP1,13 and E2p-Ala (E2p with a Lys41→Ala mutation), after lipoylation with 300 nM LplA for 30 minutes, and staining with anti-lipoic acid antibody. The plots show the distribution of single yeast cells as a function of phycoerthyrin staining intensity (reflecting extent of lipoylation) and c-Myc staining intensity (reflecting expression level of the Aga2p-LAP fusion). A cell population on the lower left is present in all three samples, and represents untransformed yeast. Optimized sorting gates, used for the model selections, are shown in red. (C) Results of model selections. E2p-displaying yeast and LAP1-displaying yeast were mixed at ratios of 1:10, 1:100, or 1:1000, labeled with 300 nM LplA for 30 minutes, and sorted. PCR analysis gives the ratio of yeast populations pre- and post-selection. E2p enrichment factor was >103-fold.

