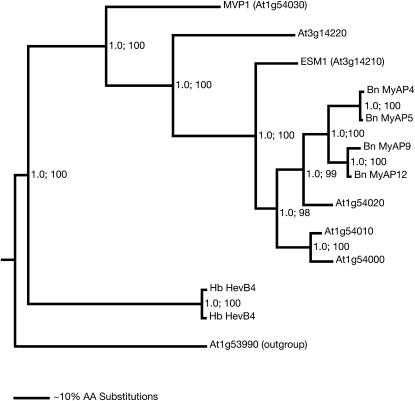
Figure 4.
Phylogram of the nearest neighbors of MVP1. Protein sequence similarity searches with BLASTP were used to assemble the GDSL superfamily. The identified 907 members were organized in a large neighbor-joining tree. MVP1 mapped in this tree to a subclade with 12 members sharing amino acid sequence identities of greater than 40%. These 12 sequences plus one more distant sequence (less than 35% identity) were used to generate the phylogram shown here with the MrBayes software. The distant sequence (At1g53990) served as an outgroup for rooting the tree. The posterior probabilities, generated by the Bayesian analysis, are given by the first value at each branch point. The same sequences were used for a neighbor-joining analysis with the PHYLIP software. This analysis resulted in a tree with an identical branching pattern. The relative bootstrap values derived from 1,000 resampling steps in the neighbor-joining analysis are given as percentages by the second value at each branch point. In the given tree, the most closely related members are five sequences from Arabidopsis and four from oilseed rape (Bn). A rubber tree (Hevea brasiliensis) homolog is more distantly related (Hb). A relative distance scale is given at the bottom. AA, Amino acids.

