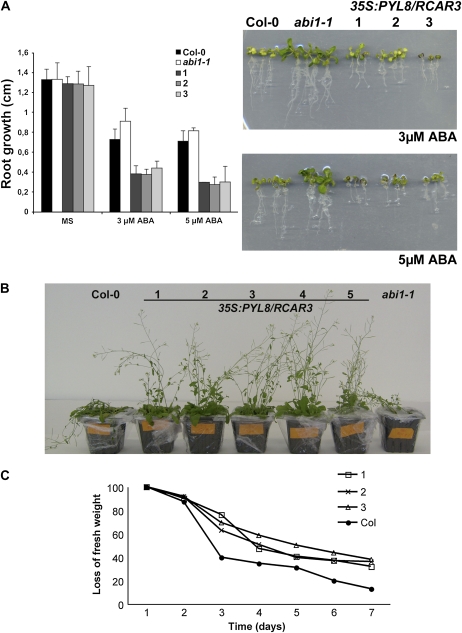
Figure 6.
Vegetative phenotypes of 35S:PYL8/RCAR3 plants. A, Root growth inhibition assay for scoring ABA hypersensitivity. Growth of Col-0 and abi1-1 plants and three independent 35S:PYL8/RCAR3 lines (1–3) in medium lacking (MS) or supplemented with 3 and 5 μm ABA is shown. Data are averages ± se from three independent experiments (n = 20 seedlings per experiment). Photographs show representative seedlings 7 d after the transfer of 5-d-old seedlings from MS to plates supplemented with 3 and 5 μM ABA. B, Whole plant transpiration assay. Photograph showing the drought phenotype of five independent 35S:PYL8/RCAR3 lines (1–5) compared with wild-type and abi1-1 plants. C, Loss of fresh weight measured in whole plants of either Col-0 or three independent 35S:PYL8/RCAR3 lines (1–3). Data values represent one of three independent experiments with similar results, and se in all the genotypes and time points is less than 5%.

