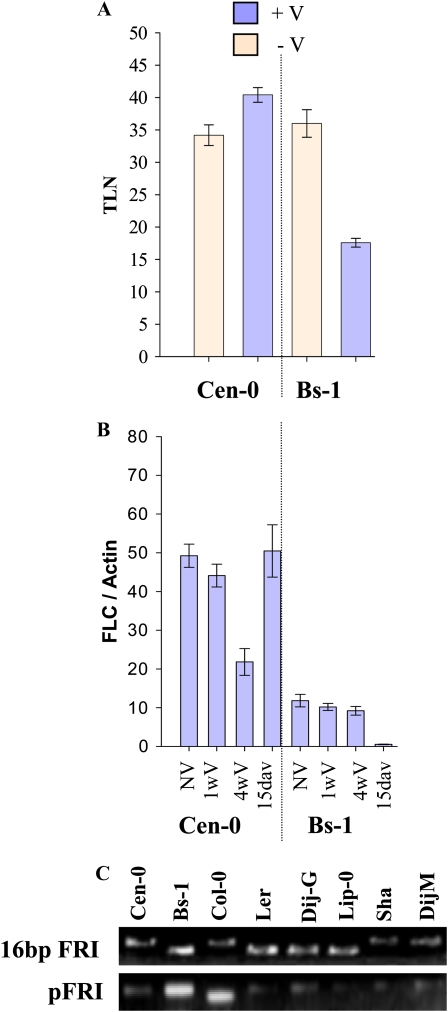
Figure 3.
Vernalization response of Bs-1 and Cen-0 accessions under 14-h days and its relationship to FLC expression levels. A, Flowering times of Bs-1 and Cen-0 accessions with or without vernalization. Flowering time is plotted as total leaf number (TLN) on the y axis. The accessions with or without vernalization are arranged on the x axis. B, FLC mRNA abundance before, during, and after vernalization in Bs-1 and Cen-0 accessions. FLC mRNA level relative to actin mRNA level is plotted on the y axis. Each accession without vernalization (NV), exposed to vernalization for 1 or 4 weeks (1wV and 4wV, respectively), or exposed to vernalization for 4 weeks and then returned to normal growth temperatures for 15 d (15dav), are arranged on the x axis. C, Analysis of FRI alleles present in selected accessions. Polymorphisms associated with a 16-bp deletion in the coding sequence (top) or a deletion in the promoter (pFRI; bottom) were tested. Ler and Col-0 act as controls. Ler carries the 16-bp deletion in the FRI coding sequence, whereas Col-0 carries the deletion in the FRI promoter. [See online article for color version of this figure.]

