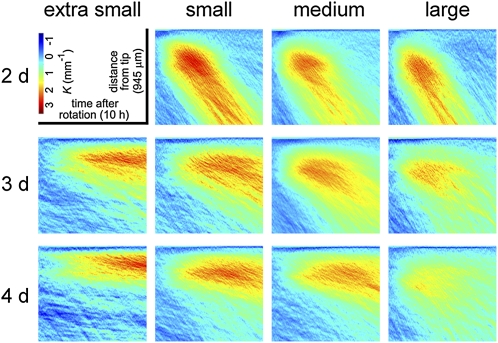
Figure 10.
Distribution of curvature along the root axis during gravitropism throughout the condition space. Color-coded curvature (K in units of mm−1) is shown at each point along the midline of the root apex (y axis) beginning 60 μm from the tip (top edge of each section) and extending back 945 μm at each time point (x axis) over the 10-h experiment. The plots, which are the averages of at least 40 roots per condition, show where along the root midline, when, and to what extent curvature developed after reorientation, at each position in the condition space.

