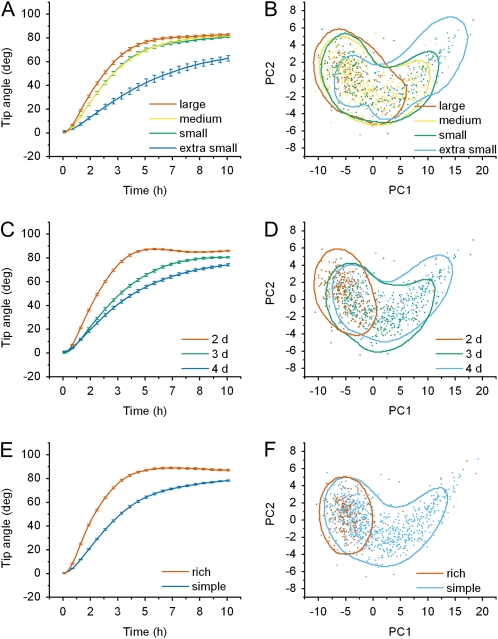
Figure 3.
Tip angle development throughout the conditional space. A, Average tip angle development for each seed size class. B, Principal components coefficients of the entire root data set colored according to seed size class. C, Average tip angle development across developmental time. D, Principal components coefficients colored according to developmental age. E, Average tip angle development of seedlings grown on either rich or simple medium. F, Principal components coefficients of all individuals colored according to media condition. The contours in each principle components plot outline where 75% of the data for each population should lie.

