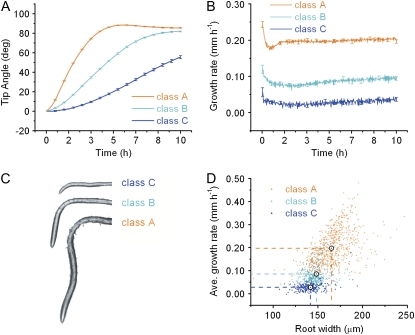
Figure 4.
k-means clustering of tip angle responses into three distinct classes. A, Average tip angle development of each k-means defined class. B, Average growth rates of the k-means defined tip angle responses. C, Representative roots at 10 h after gravistimulation from each of the classes. In addition to showing differences in final root length and tip angle between the classes, there is an apparent difference in root width. D, Average growth rate plotted against root width at 10 h of gravistimulation. The data are colored according to k-means class.

