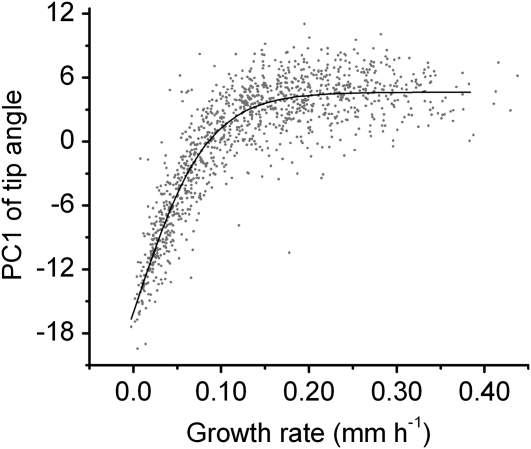
Figure 6.
Relationship between tip angle and average growth rate throughout the condition space. PCA was performed on the entire population of tip angle responses. Plotted is PC1 of the tip angle versus the average growth rate of the same individual for each individual in the data set. Growth rates below 0.10 mm h−1 reasonably predict tip angle development of an individual. Growth rate is not a good predictor of tip angle when the root grows faster than 0.10 mm h−1. The line is a Boltzman equation fit to the data.

