Figure 8.
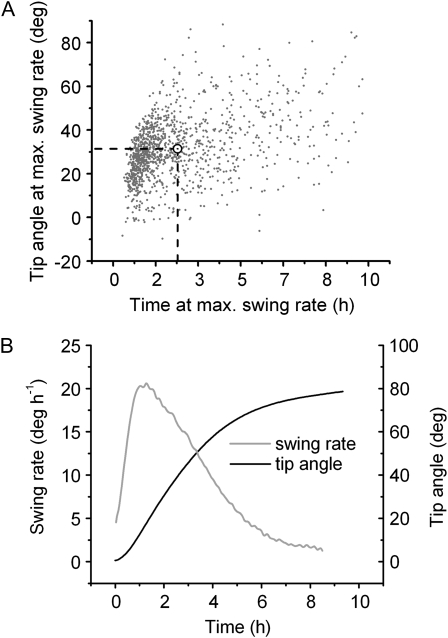
Relationship between swing rate and tip angle. A, The tip angle at the time of maximum swing rate versus the time when swing rate was maximal. The dashed lines show that the average maximum swing rate of the data set occurred when the tip angle was 30° on average, and 2.5 h after gravistimulation, on average. B, The average swing rate (gray) and the average tip angle (black) response of the entire data set.

