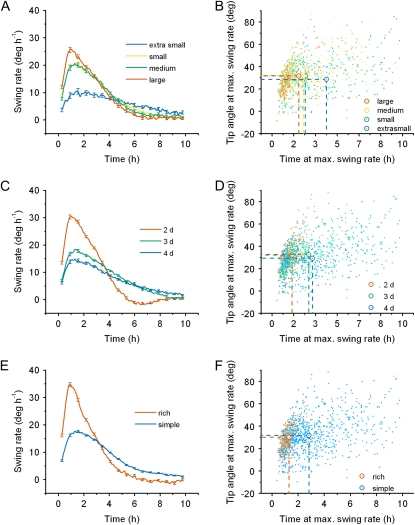
Figure 9.
Patterns in swing rate and time to reach maximum swing rate throughout the condition space. A, Average swing rates of roots coming from each seed size class. B, Tip angle and time to maximum swing rate by seed size class for each individual root. C, Average swing rates of roots over developmental time. D, Tip angle and time at the maximum swing rate grouped by developmental age. E, Average swing rates of roots grown on simple or rich medium. F, Tip angle and time at the maximum swing rate grouped by growth medium. The enlarged points within these plots indicate the population means for each condition.

