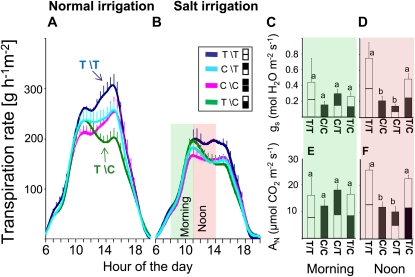
Figure 3.
Daily transpiration rate, gs, and AN for grafted plants under normal and 100 mm NaCl irrigation. A and B, Whole-plant mean daily transpiration rate normalized to leaf area of all reciprocal grafted TOM-NtAQP1 and control plants measured simultaneously under normal irrigation (A) and after 3 d of 100 mm NaCl irrigation (B; T/T n = 3, C/C n = 3, C/T n = 8, T/C n = 6). se is given for each 10th sampling point; when not seen, se is smaller than the line. The green area represents morning hours, 8:00 to 11:00 am, and the light-red area represents noon hours, 11:00 am to 2:00 pm. At these hours and under the same salt conditions, parallel measurements of reciprocal grafted scions were conducted for gs and leaf AN, during the morning hours (C and E) and the noon hours (D and F). Bars represent means ± se of grafted plants (white for TOM-NtAQP1 and black for control; T\T n = 3 for morning and noon, C/C n = 4 for morning and n = 11 for noon, C/T n = 6 for morning and n = 5 for noon, T/C n = 5 for morning and n = 6 for noon). Different letters indicate significant differences (t test, P < 0.05). All measurements were performed in a semicontrolled greenhouse (see “Materials and Methods”); gas-exchange measurements were conducted with a portable apparatus (Li-6400) on young, fully expanded leaves.

