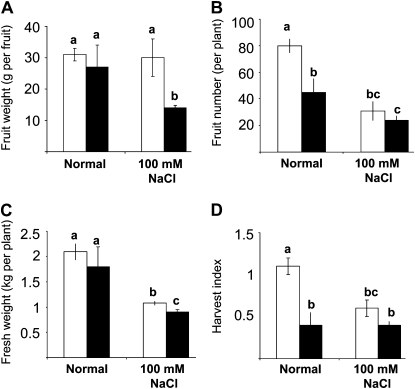
Figure 4.
Yield parameters of TOM-NtAQP1 (white bars) and control plants (black bars). Plants grown for 3 months in a controlled greenhouse under normal (nNtAQP1 = 8, ncontrol = 3) and 100 mm NaCl (nNtAQP1 = 5, ncontrol = 5) irrigation conditions. Columns represent means ± se of individual fruit weight (A), fruit number (B), shoot fresh weight (C), and harvest index (D). Different letters indicate significant differences (t test, P < 0.05).

