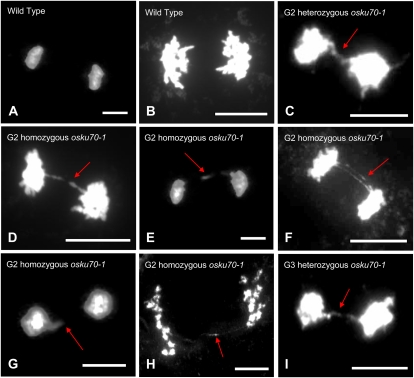
Figure 9.
Cytogenetic analysis of PMCs from wild-type (A and B) and heterozygous (G2 and G3; C and I) and homozygous (G2; D–H) osku70-1 mutant rice plants. Anaphase chromosomes were stained by DAPI. Arrows show abnormal anaphase bridges. No anaphase bridges were detected in wild-type PMCs. Bars = 10 μm. [See online article for color version of this figure.]

