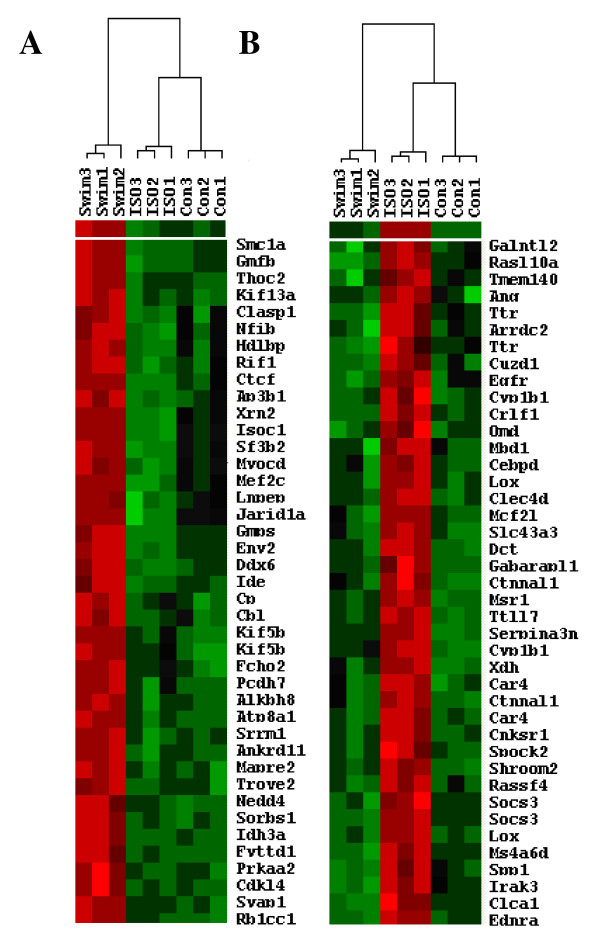
Figure 5.
ISO-treatment an exercise induce differential transcriptional profiles. Hierarchical clustering of genes altered in mouse hearts in response to exercise (A) or ISO treatment (B). Bright red indicates the highest normalized signal values, bright green represents the lowest signal values, and black represents median signal values. The heat map was produced by clustering normalized signal values (exported from GeneSifter) using Cluster/Treeview software. Abbreviations used are as follows: Swim = exercised mice, ISO = isoproterenol-treated mice and Con = sedentary control mice. Replicates samples are indicated by number (1 -3). Only subsets of each clustering result are shown, with gene symbols provided to the right of each set of array probes (i.e., each row represents one gene, and each column represents an individual experimental sample).

