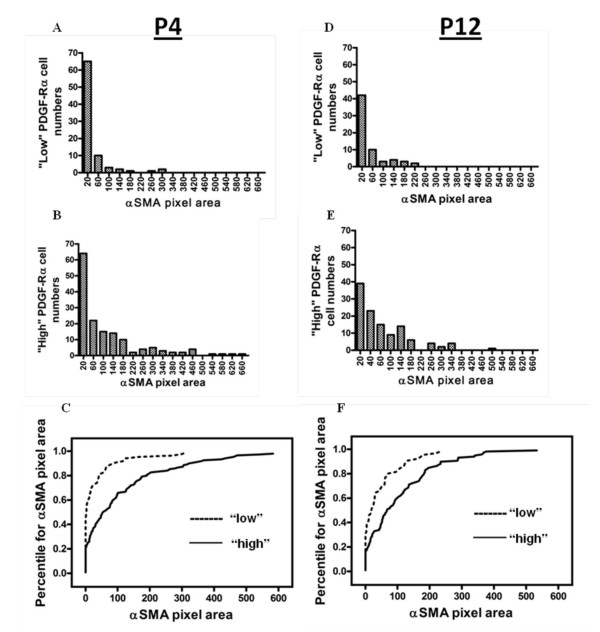
Figure 6.
Distribution patterns of αSMA around "low" and "high" PDGF-Ra-GFP nuclei in intact tissue. Frequency distribution histograms summarizing confocal image analysis of stained intact tissue from mice aged P4 (A - C) and P12 (D - F). A circle measuring 9 μm in diameter was drawn around each PDGF-Rα-GFP nucleus in an alveolar entry ring (Figure 5), and the pixel area of αSMA that fell within this region of interest was calculated. Statistical differences between the distribution of αSMA within the "low" and "high" populations at each age were calculated using the Kolmogorov-Smirnov (KS) test. KS-test comparison percentile plots for P4 (C) and P12 (F) are shown. The αSMA pixel area values were ranked from lowest to highest, and the percentile for each value was determined (for example, the median value would be the 50th percentile, or 0.5). The cumulative fractions were then plotted on the Y-axis, against the αSMA pixel areas on the X-axis. The αSMA distribution curves were statistically different (P < 0.05) between the "low" and "high" populations at each age. For each mouse, 16-18 alveolar entry rings were examined, and n = 3 mice at each age.

