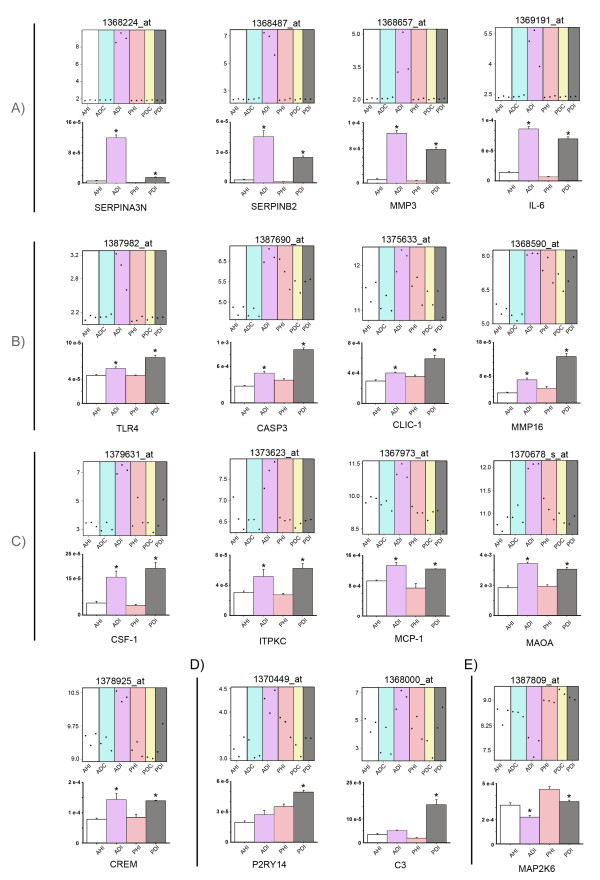
Figure 3.
Microarray and quantitative Real-time PCR (qPCR) validation of genes differentially regulated in the dorsal root ganglia 7 days after SNI surgery. The figure shows microarray plots of the selected Affy_IDs and counterpart graphs of qPCR validation of the corresponding gene. For clarity, genes have been grouped into A) 'preferentially expressed in adult SNI', B) 'preferentially expressed in young SNI', C) 'genes equally expressed in both adult and young SNI groups', D) 'genes specific to young SNI' and E) 'downregulated gene group'. In the microarray plots, the y-axis indicates the normalised log2 value of expression and each point represents the level of a particular Affy_ID in a single array. In the qPCR validation graphs, the y-axis indicates the mean fluorescence intensity (± standard error). White: Adult sham rats (AHI); Blue: Adult SNI rats, contralateral (ADC); Purple: Adult SNI rats, ipsilateral (ADI); Pink: Young sham rats (PHI); Yellow: young SNI rats, contralateral (PDC); Grey: Young SNI rats, ipsilateral (PDI). For each gene, an ANOVA was performed and p < 0.001. * represent the differences with all experimental groups p < 0.05 in a 'post-hoc' Tukey test or SNK-test, power>80%.

